Category: News

Your Next Car May Be Electric – Why Not Fuel It With Solar Power?

Charging Electric Car with Home Solar Power System

Whenever news stations and magazine articles cover the topic of electric vehicles (EVs), the conversation is typically centered around Tesla. The automaker seems to be perceived as the only major electric car manufacturer of note. But the truth of the matter is that most mainstream automakers are currently adding electric vehicles to their lineups, even developing electric-powered versions of their most popular models.

Here are some of the highlights to look out for in the next few years:

Volkswagen: Fueled in part by the emissions testing scandal that played out in the media a couple years ago, Volkswagen is now planning on offering 50 models of fully electric vehicles by 2025, and expect to sell 2 to 3 million electric cars per year by that time. Their electric vehicle lineup will be headlined by the Volkswagen I.D. series of cars, vans, and SUVs. Base model I.D.’s will be priced at less than $30,000 and offer a range of 206 miles on a single charge, with upgraded options having ranges up to 340 miles.

Hyundai: While Hyundai has dipped its toe into hybrid/EV development with the Ioniq Electric and Konda Electric, the company is now in the process of making a full-scale plunge. By 2025, Hyundai plans one of the world’s top-3 EV manufacturers, looking to offer 44 models of hybrid and electric vehicles. But even the company’s existing vehicles are quite capable, with the Kona Electric SUV having a range of nearly 260 miles, at a price a hair under $36,500.

Nissan: Nissan has long been heavily invested in the development of electric vehicles. The first all-electric Nissan Leaf rolled off the manufacturing line nearly 10 years ago, which has given the automaker time to refine their approach. The 2018 model retails for less than $22,500 after tax credits, and offers the ability to get 90 miles’ worth of charge in only 30 minutes with a fast charger.

Audi: For those looking to find a car that’s classy, green friendly, and powerful, German automaker Audi has been developing its electric and hybrid e-tron line since 2009. The first mass-market all-electric model is debuting in the United States in 2019. The introductory model boasts 402 horsepower, a top speed of 124 miles per hour, and a zero to 60 time of 5.7 seconds.

Just about every other major car manufacturer is upping their investment into the growing electric vehicle market. However, the extent of commitment varies from company to company.

American manufacturers appear to be testing demand by pushing sales of electric vehicles in China. But on the other hand, Volvo is aiming for a goal of 50% of its new cars being fully electric, while Porsche is clearly taking direct aim at Tesla’s target market, reportedly doubling the production capacity for their new all-electric Porsche Taycan after being surprised by the strength of consumer demand.

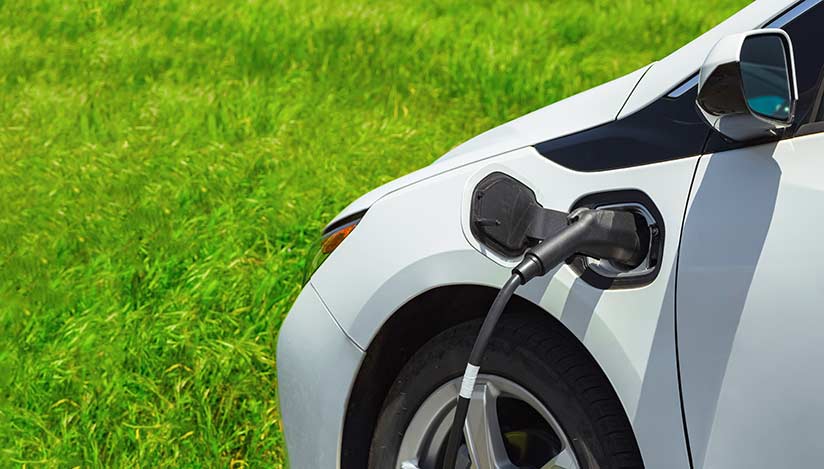
Electric vehicles are clearly going to become a hot commodity in the next few years. If you’re not already driving a hybrid or plug-in electric vehicle, the odds of your next car lacking a gas cap are rapidly increasing. But how are you going to power it?

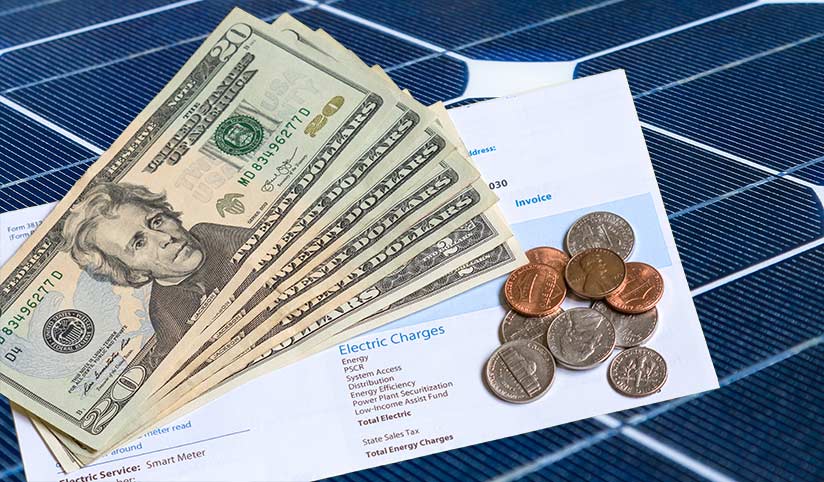
Charging an electric vehicle is cheaper than fueling up at a gas station, but it’s not cheap.

Understanding the cost of ‘fueling’ an electric car requires a fairly radical reframing of how you think about a car’s efficiency. Phrases like ‘fuel economy’ and ‘gas mileage’ and ‘miles per gallon’ don’t apply to electric vehicles (though they still do with hybrids).

For electric cars, there are two important metrics for energy usage: ‘kilowatt-hours per 100 miles,’ and ‘cost to charge.’ The first is the electric alternative to ‘miles per gallon,’ which allows car buyers to compare the efficiency of different car models. The more electricity that a car uses to drive 100 miles, the less efficient it is. (You will sometimes see the term ‘MPGe,’ which indicates how many miles a car can drive on a charge of 33.7 kilowatt-hours (kWh), the energy equivalent of one gallon of gas, but this metric is confusing and will likely fall by the wayside.)

Calculating the ‘cost to charge’ an electric vehicle requires the consideration of a couple factors—how much electricity the car’s battery can hold, and how much electricity costs in your area.

Here’s a rundown on the standard base model energy capacity of some of the best-selling all-electric cars in the United States as of 2019:

  • Tesla Model 3: 50 kWh
  • Chevrolet Bolt EV: 60 kWh
  • Honda Clarity Electric: 25 kWh
  • Nissan Leaf: 40 kWh
  • Hyundai Ioniq Electric: 28 kWh

Bear in mind that just about every model of electric car offers larger battery options for extended driving time. But most battery capacity options are between 25 and 60 kWh. Driving range varies depending on capacity, with most EVs able to drive 150 and 250 miles on a single charge.

All these variables make it challenging to estimate how much it costs to drive an electric vehicle. But here’s a middle of the road example. If you own a standard Nissan Leaf (which has a 40-kWh battery with a range of 150 miles per charge) and drive about 300 miles per week, you’ll have to charge it twice per week. This would require 80 kWh of electricity, which under PG&E’s time-of-use rates would cost anywhere from $15 to $30.

This is less than you would pay at the gas pump, but it does add up over time. Why spend thousands of dollars on electricity over the life of your car when you could instead invest it into a solar power system? You could effectively drive for free, while saving tens of thousands of dollars on your energy bills. But buying a solar power system does require a bit of planning.

Even if you don’t yet own an electric vehicle, you’ll want to factor the need to charge one in your solar power plan.

We often assist homeowners with expanding their existing solar power systems after they have purchased an electric vehicle. However, it’s significantly more cost effective to anticipate this need, and buy your solar power system with it in mind.

By planning ahead, we can account for the need to charge a vehicle when sizing out your solar power system. Even better, if you plan on purchasing an electric vehicle in the near future, we can help you pick the right vehicle charging station and install it while we’re installing your new solar panels—we often work with Clipper Creek in Auburn, but can also help with other charging stations.

You should also know that PG&E offers special rate plans to electric vehicle owners, and SMUD offers a 1.5 cent per kWh credit when you charge your vehicle between midnight and 6 a.m. While charging your vehicle in the middle of the night may sound inconvenient, many vehicles allow you to set a charging schedule (as an example, Hyundai published a brief video guide for setting a charging schedule in the Ioniq Electric).

Obviously, there’s a lot to consider—whether to go solar, whether to buy an electric (or hybrid) vehicle, whether to customize your solar power system to account for vehicle charging—but Capital City Solar can help you make sense of it. Contact us today and we’ll work with you to identify whether solar is right for you, and what systems best meet your needs.

How Much Does Electricity Cost from Solar Panels vs. Your Local Utility?

Cost of electricity from solar panels versus utility companies like PG&E and SMUD

Our customers are often concerned about the upfront cost of buying a solar power system. This hesitation is completely understandable. After all, solar is a significant long-term investment. But that’s just it—it’s an investment.

There’s an analogy we’ve used with customers on occasion:

Imagine that back in 1994, when gas was about $1.15 a gallon ($1.96 with inflation), you buried the tank from an 18-wheeler in your backyard. If you could have used that gas for your cars for the next 25 years, right up to today, would you have been happy with your investment?

The answer is always an emphatic “Yes!” Two bucks a gallon would feel like a steal these days, even when prices aren’t bad—to say nothing of the times over the past couple decades when prices have risen towards $5 per gallon.

Solar is the just about the exact same thing (without the risk of having thousands of gallons of gas in your backyard!). Just like that tanker, solar power requires an upfront investment. But the savings will far exceed the initial cost.

How much does electricity produced by solar panels cost?

To estimate what electricity from a solar power system will cost—effectively, what the owner’s ‘electricity rate’ will be—requires understanding how much electricity the system will produce over its lifetime. That depends upon the system in question, of course, as different brands of solar panels degrade at different rates over time.

For instance, SunPower now guarantees that their panels will degrade at such a slow rate that even after 25 years, the panels will produce 92% of their original capacity.

When we produce an energy estimate, we take a conservative approach. We assume that the system will meet the warranty’s minimum guarantee for a period of 25 years, calculate how much electricity it will produce during that time, and divide that figure by the cost of the system. Depending on the specifics of the system, solar-sourced electricity works out to around 8 to 12 cents per kWh (kilowatt-hour) over the life of the system.

In many cases, especially with SunPower, that estimate is much closer to 8 cents than 12. And remember, that doesn’t take into account that many SunPower systems will continue to operate well into their 30s, and have a good chance of operating at 90% of original capacity at the 40-year mark. Potentially, you could pay a lot less than what we estimate, but we like to err on the side of caution.

So, the rule of thumb is that at worst, you’ll pay 8 to 12 cents per kWh for electricity produced by your solar power system.

How much will electricity produced by a local electrical utility cost long-term?

We’ve discussed in pretty exhaustive detail how we project how much electricity produced by PG&E and SMUD will cost long-term. But to keep it brief, according to PG&E’s 2019 time-of-use rate schedule, the average summer rate is 36 cents per kWh, and the average for winter is 27 cents/kWh.

Right off the bat, electricity from solar power is less than half the winter rate, and a third of the summer rate. And that’s today.

If you’re reading this in 2020 or 2022, then that rate is going to be higher. When your solar power system is still putting power out in 2044, you can bet that rates will be higher still. We currently estimate that SMUD’s rates will increase by 3.7% per year, while PG&E’s will increase by 5% per year (assuming, of course, that bankruptcy doesn’t affect that figure).

You might be surprised by how quickly that adds up. A $200 SMUD bill in 2019 will cost $414 in 20 years, and a $200 PG&E bill will cost $531. How comfortable are you about the idea of paying energy bills that cost twice as much, or more?

Remember that metaphorical tanker truck we talked about earlier? Would you rather start saving money now by locking low energy rates in with a solar power system, or wait until your energy bills double, just like gas costs have over the past couple decades?

How Many Solar Panels Do You Need For Your Home?

How many solar panels do I need for my home?

When customers ask us about installing a new solar power system, they’re often thrilled at the idea of completely zeroing out their yearly energy bill. After all, how great would it be to not have to worry about paying anything but your utility company’s monthly maintenance fees?

But deciding how much roof real estate to cover up with panels isn’t an easy decision. Solar panels are pretty noticeable. We’re often asked, “How many solar panels do I need?” No two customers’ energy needs are the same, so our answer is usually, “It depends.” But we can show you how to begin answering that question for yourself.

Estimate your average monthly energy usage.

To the surprise of some of our customers, the size of their home has very little to do with sizing a solar power system, beyond the maximum size your system can be due to the roof space available. While in some respects it’s accurate that larger homes have greater energy demands (more space to heat or cool, and so on), there are many exceptions. After all, a 2,500 square foot house may be home to a retired couple that goes to bed at 8:30 every night, while a 1,500 square foot home may have four kids and their parents living in it, with a heated pool in the backyard. Odds are it’s not the retirees who are going to be getting hit with pricey energy bills each month.

When we’re preparing a quote for customers, what we really care about is how much electricity they use, because this is what determines the size of the system needed to offset that usage. When we’re calculating an energy quote for a PG&E customer, we’re able to call the utility company through a designated contractor line and pull historical usage data. SMUD doesn’t have this feature, but instead provides access to historical usage data through an online application called UtilityAPI.

As time goes on, services like UtilityAPI will likely be the future of how we generate quotes, as we can collect data on usage behaviors on an hour-by-hour basis. This level of accuracy for projecting energy costs is becoming necessary due to the advent of time-of-use rates (or ‘time-of-day’ rates, as SMUD calls them). A few years ago, there would have been no difference between two families that used the same amount of energy on different schedules. Today, under time-of-use rates, households that use the bulk of their electricity in the early evening may pay twice as much as those that use the same amount of electricity, but avoid doing so during peak-cost early evening hours.

While it’s difficult to estimate your energy costs based on your habits alone, you can still pencil out a back-of-the-envelope estimate by logging into your SMUD or PG&E account and finding your average usage. However, if you’re already feeling a little overwhelmed by the math—and there’s still more to come—we recommend that you give us a call and let us handle the work of putting together an estimate.

But if you still want to figure it out for yourself, here’s what you do once you have your usage information.

Determining how big of a solar power system you’ll need to cover your energy costs.

Let’s say that when you log into PG&E’s or SMUD’s website, you find out that you use 12,000 kWh of electricity per year, an average of 1,000 kWh per month. (If you want to be really cautious, you can take the average of the months when you use the most electricity, which is usually in the summer—taking this approach will mean you won’t have to deal with energy bills when your usage is higher than normal.)

Divide this monthly average by 30 (the average number of days in a month) to get a daily average—in the case of our example, about 33 kWh per day. If your goal is to cover all of your energy costs, you need a solar power system that can generate an average of 33 kWh per day.

How big of a system does it take to do that? Well, that’s a complicated question. The amount of power generated by a solar power system depends on where you live, how much shade your house gets, and the time of year. Solar power systems are rated on the number of kilowatts of energy they can produce in a given moment under the best possible conditions. A reasonable rule of thumb is that for every kilowatt that a solar power system can generate, it will produce about 3 to 4.5 kWh of energy per day, depending on conditions. Let’s take the average and call it 3.75 kWh for every kilowatt that a solar system is rated for.

So, if you take your average daily energy usage in kWh, and divide it by 3.75, that will tell you roughly how many kilowatts your solar power system would need to be rated for to cover your average bill. In our example, dividing 33 kWh per day by 3.75 equals 8.8, meaning the homeowner in our example would want a solar power system capable of producing a maximum of 8.8 kilowatts, or 8,800 watts. (This means that if it ran at peak performance for one hour, it would produce 8.8 kilowatt-hours. You take the number of kilowatts and multiply it by the number of hours to calculate the number of kilowatt-hours produced.)

Then, it’s just a matter of comparing solar panel models and seeing how many panels of a particular model you would need.

Our example homeowner knows they need a solar power system that can produce about 8,800 watts. Individual solar panels are rated for their energy production in watts. This means we can divide our desired total solar power output by the energy production of one panel, and calculate how many solar panels we need.

Many solar panels are rated for 320 watts. Dividing the system output you need by a single panel’s output will give you the number of panels you need. In this case, 8,800 watts divided by 320 watts is 27.5. You’ll need about 27 or 28 panels with an output of 320 watts to meet your goals.

However, not all panels have the same output, and can vary by manufacturer or model. The number of panels needed will increase or decrease depending on this output. Consider the panels made by SunPower, most of which are rated for 360 watts. 8,800 watts divided by 360 watts is 24.4—meaning you would need about three fewer panels than you would if using 320-watt panels. That’s a noticeable reduction that also affects the cost of your system.

As we said earlier, the number of solar panels you need depends on a lot of things, including:

  • Your household’s energy usage
  • What the weather and shade conditions are like where you live
  • How much electricity is produced by the model of solar panel you choose

But let’s stop right there. We know this is a lot of math to take in. If you don’t want to do the math, you don’t have to. Give Capital City Solar a call today, and we’ll make an appointment to sit down with you, figure out your energy usage habits and what future plans you may have—a new electric vehicle or backyard spa—that would increase your usage, and put together an estimate of how large of a solar power system you need to accomplish your goals. Give us a call and let us handle the numbers.

Building Solar Panels is a Dirty Business - Why Sustainability Matters

How SunPower is Cleaning Up Solar Panel Manufacturing

Solar power’s popularity has continued to increase for the last several years, despite costly tariffs and other efforts to bolster traditional fossil fuel industries. There’s a key reason for this. With old forms of power, you consume a finite resource every time you need electricity. Every time you flip on the light switch, you burn gas, coal, or oil to generate the electricity you need and you have to deal with the pollution that results.

Solar power is a one-time deal. Once you’ve invested the money and resources into the manufacture of solar power modules, you get to coast for the next several decades. That’s huge—no traditional energy source can match the efficiency of solar panels.

Despite these advantages, there are still environmental concerns. Manufacturing solar panels, like any other type of electronic device, is a dirty business. The process uses toxic chemicals, releases pollutants, and consumes valuable resources.

That’s why SunPower is trying to reduce the environmental impact of manufacturing solar panels, in order to make solar sustainable during production and in use.

Manufacturing solar panel semiconductors consumes massive amounts of water.

If it weren’t for semiconductors, we would be stuck in the 1950s. Your phone, computer, car, television—they all contain semiconductors. They are the beating heart of our computerized society, allowing our devices to ‘think’ and interact with one another.

Solar panels are no exception. In fact, solar panels use a massive amount of semiconductors, which absorb sunlight and begin the process of producing usable electrical energy.

But what most people don’t know is that manufacturing semiconductors consumes massive amounts of water. Manufacturing a one-foot wide wafer of semiconductors, about 0.75 square feet in area, consumes about 2,200 gallons of water. A typical solar power installation needs several square feet of semiconductors.

A single, decent-sized semiconductor fabrication facility can consume nearly 5 million gallons of water per day, or 1.75 billion gallons per year. For perspective, that’s more water than Sacramento, which has a population of more than 500,000 people, uses in any single month between November and March. Now consider that demand for solar systems requires many such facilities all over the country, all using water at this astonishing rate. You can see the need to find ways to improve upon the manufacturing process!

This is why SunPower’s research facility in Silicon Valley has been dedicated to finding ways to reduce the amount of water needed to fabricate semiconductors and other elements used to build solar panels. They are also working on methods to reduce the amount of electricity needed during manufacturing, ensuring that panels are more energy efficient even before they roll off the assembly line.

Solar panels—like other electronic devices—contain a lot of nasty chemicals and require custom recycling solutions to prevent pollution.

Manufacturing solar panels requires the use of exotic and sometimes toxic materials, some of which are incorporated in the solar panels themselves. Chief among these potential pollutants are:

Cadmium telluride. This heavy metal is particularly handy for manufacturing certain types of solar cells. While the toxicity of cadmium telluride has been reduced in recent years, it’s still a mild carcinogen that can contaminate the environment if improperly disposed of.

Copper indium gallium selenide. Another useful material with valuable semiconducting properties, copper indium gallium selenide and other indium compounds used in solar cell manufacturing are known to cause lung damage.

Lead. While usage of this metal, which is a neurotoxin, has been significantly decreased in recent years, it’s still used in the manufacture of some solar panels.

Then there are toxic chemicals like sulfur hexafluoride, silicon tetrachloride, and others which aren’t present in the panels themselves, but which are used during the manufacturing process or are produced as a byproduct. SunPower has been endeavoring to reduce the usage of toxic chemicals in the manufacture of solar panels, as well as the amount of such materials present in the final product.

These efforts have paid off. Since 2013, the Silicon Valley Toxics Coalition (SVTC) has scored solar power manufacturers on their efforts to reduce the usage of toxic materials in solar panels, as well as the reduction of chemical usage during the manufacturing process. Every year, SunPower has achieved the maximum possible scores.

In fact, on the SVTC’s 2015 and 2016-2017 scorecards, SunPower has been the overall top-rated manufacturer in the photovoltaic industry—a recognition of its efforts to protect employees, customers, and the environment. The 2018 scorecard is due to be released sometime in 2019, and we’re eager to see if they continue to top the list.

Despite the progress made, SunPower recognizes that existing solar panels still contain potentially dangerous amounts of toxic materials. That’s why SunPower operated its own specialized panel recycling program for many years, before joining the Solar Energy Industries Association’s (SEIA) nationwide recycling program. Through this program, a network of collection points has been developed. Vendors that can break down and recycle solar panel components in a safe and sustainable manner have been identified, preventing these materials from contaminating our landfills.

But SunPower isn’t satisfied with ensuring that solar panels are diverted from American landfills. SunPower is one of only two companies to offer recycling solutions in the world.

This is just another reason why we’re proud to be a dealer of SunPower products, and regularly recommend them to our customers. It’s our hope that SunPower continues to push further in their efforts to not only clean up their own manufacturing processes, but to push the industry as a whole towards cleaner, more efficient, and more environmentally sustainable fabrication solutions.

How PG&E’s Bankruptcy Will Impact Solar Customers

Pacific Gas and Electric Bankruptcy Impact on Solar Customers

On January 14th, 2019, Pacific Gas & Electric announced that it would file Chapter 11 bankruptcy. This action does not mean that the company will stop supplying electricity or be dissolved. Instead, filing for bankruptcy allows them to restructure their debts and shed some of their financial obligations.

This is an extremely significant decision, reflecting the precarious situation that the company is in. PG&E is a publicly traded company, and has long been a very stable and successful one. Between 2009 and early November of 2018, PG&E’s stock traded between $38 and $68. But in the weeks following the devastating Camp Fire, the company’s stock price dropped from $47 to a low of less than $6.50.

As of late January 2019, PG&E’s stock is priced at $12, and the company as a whole is valued at about $6.25 billion. PG&E estimates that the financial damages it will ultimately face for its role in the fires of 2017 and 2018 will amount to at least $30 billion, five times the company’s current worth.

This is why PG&E has filed bankruptcy—to slow down and consolidate the many lawsuits filed against it, and to raise money by selling off assets. But this is going to be a very touch and go period for PG&E, its investors, and the five and a half million people and businesses that purchase electricity from the company. The company’s attempt to save itself may ultimately fail, with Chapter 11 bankruptcy becoming Chapter 7 bankruptcy.  In this scenario, we would likely be looking at the state of California taking over the company’s massive operations—an option which the state has been considering since December of 2018.

But in the meantime, how will PG&E’s Chapter 11 bankruptcy filing impact its customers, particularly those who have solar power? The bankruptcy process is slow. When PG&E filed for bankruptcy in 2001, it took the company three years to complete the process. As this bankruptcy plays out, assuming there are no significant changes—such as California stepping in and taking the company over—here’s what you can expect as a PG&E customer.

Don’t worry, PG&E isn’t suddenly going to turn your power off.

As a regulated utility, PG&E can’t pull the plug on you in order to cut their costs. They are required to continue to provide electricity and natural gas services to their customers. So, you shouldn’t expect to suddenly start experiencing rolling blackouts or any other interruptions of service, as occurred during the Enron-instigated crisis of 2000 and 2001.

However, your energy rates might go up.

In December 2018, PG&E asked state regulators to approve rate increases for 2020 they estimate  would increase the average customer’s bill by 6.4%, compared to 2019. However, in their rate increase proposal, they actually request that their allowed revenue be increased from $8.506 billion in 2019 to $9.6 billion, an increase of nearly $1.1 billion which would amount to a 12.9% increase. Clearly, some customers would be hit harder than others. PG&E also requested additional revenue increases of $454 million in 2021 and $486 million in 2022. The would amount to an increase of 23.9% from 2019 to 2022.

In addition, PG&E is pursuing another $1.2 billion in rate increases between 2020 and 2022 to cover the cost of decommissioning and associated remediation of the Diablo Canyon Power Plant and Humboldt Bay Power Plant Unit 3. In addition, under a bill signed into law in September 2018, PG&E will be able to pass on the anticipated costs of future legal settlements to customers.

Historically, PG&E’s rates have increased by an average of 7.1% year-over-year since 2009. With the company’s financials in dire straits, and given the above, it appears safe to assume that PG&E’s rate increases will exceed that average for much of the next several years.

Net energy metering (NEM) likely won’t be impacted at all.

Under California’s net energy metering program, customers who generate excess electricity and send it to the grid are given a credit by PG&E—essentially, the company buys electricity from homeowners. While PG&E may be struggling financially, it is obligated by state law to cooperate in the NEM program.

Thus, homeowners should expect that they will continue to be compensated fairly for the electricity they generate, both in terms of NEM credits and net surplus compensation (NSC). The same is true of businesses and organizations that participate in the Self-Generation Incentive Program (SGIP).

New solar power users could see delays in being connected to the grid.

Many observers believe that one of the key consequences of PG&E’s financial woes will be layoffs . Reduced staffing may result in delays with processing interconnection requests, which means estimates for when your new solar power system can go live may prove to be optimistic by a few weeks.

So, the takeaway for PG&E customers with solar power systems is that your service won’t be interrupted. You’ll continue to be compensated for the energy you produce, as per the company’s legal obligations. However, your electricity bills will likely increase—possibly more so than they have in the past—and new solar adopters may see delays of days or weeks in having their systems activated if PG&E opts to lay off employees down the line.

If PG&E’s circumstances change significantly in a manner that will impact customers, we’ll keep you updated. In the meantime, if you have any questions, such as whether it makes sense to purchase a solar power system right now, please feel free to contact us!

*Image credit: Joe Mabel (Licensing: CC-BY-3.0)

How We Use Historical PG&E and SMUD Rates to Project Your Future Energy Costs

Using P&GE and SMUD Historic Rates to Project Future Energy Costs

When we put together an energy savings estimate for a client, we have to anticipate what electricity will cost in the future in order to give an accurate estimate. Historically, electricity rates have increased, and that’s unlikely to change. If your average monthly bill this year is $200, next year it’ll increase by a few dollars, a few more the next, and so on. It may drop by a few dollars occasionally, but in the long term, your billing rate will increase.

How Utility Rate Increases Impact Solar Savings Projections

To correctly calculate how much money you can save with a solar power system—and thus determine if it makes financial sense for you—we need to be able to anticipate those rate increases. Otherwise, we’ll underestimate future electricity costs, and how much money you’ll save with a solar power system.

But this allows unscrupulous solar contractors to pad savings estimates, and thus make it seem like a solar power system makes financial sense, when in fact you won’t save as much as they claim. Or they may use skewed data to suggest their system will offer better savings than a competitor’s. Let’s explain with an example.

You have an average power bill of $300 per month. You get estimates from solar companies A and B. The two companies’ systems have identical specifications, and both say their systems will cut your energy bills by 75%. But company A says their system will save you $74,726 over the next 20 years, while company B says they can save you $93,742, or about $19,000 more. But everything about the systems is the same! Where’s the difference coming from?

In this case, company A estimated that your utility company would increase their rates by an average of 3% per year, while company B estimated that rates would increase by 5% per year. If the companies used the same annual increase rate (we refer to it as the “utility inflation rate”) they would generate identical estimates of your potential energy savings.

There are two key takeaways from this:

  1. If you want to make an apples-to-apples comparison between estimates from multiple contractors, try to get all of them to give you a projection based upon the same inflation rate.
  2. If you want an accurate estimate of your potential savings—whether you’re deciding if solar is right for you, or just because you want to know your future energy costs—you’ll need to know the rate at which your utility company has historically increased their electricity rates.

Thankfully, if you’re a PG&E or SMUD customer, we can help you with that.

Historical PG&E Electricity Rate Increases

PG&E has a massive number of rate plans, and the various usage tiers and other variables makes it challenging to calculate historical rate increase trends. This is complicated by the fact that PG&E is currently shifting customers over to time-of-use (TOU) plans. If you’re currently on a fixed-rate plan, we’ll have to make some rough estimates based on your habits to anticipate what your energy costs will be like under a TOU plan, and then project future rates from there.

It is pretty challenging to develop a forecast for TOU plan rate increases, because there are a lot of different prices to consider: peak hour, off-peak hour, part-peak hour, summer versus winter rates, baseline and over baseline charges, and so on. Another factor making historical analysis difficult is the fact that PG&E has dropped some popular rate plans, such as their E-7 TOU plan, while rolling out others, like their E-TOU-A and E-TOU-B plans.

But PG&E has continually offered the E-6 TOU plan since 2008, which gives us a long-term trend to analyze:

PG&E E6 Time-of-Use Plan Historical Peak and Off Peak Rates

The PG&E E-6 plan’s off-peak summertime rates have more than doubled, from 8.5 cents in 2008 to nearly 18 cents in 2019. Meanwhile, their peak rates have also increased, from 29.3 cents to 37.1 cents. The off-peak rate increased by over 100% in 11 years, while the peak rate increased by 26.6%.

For our purposes, just calculating the yearly inflation rate for off-peak hours will probably suffice for getting a general idea of PG&E’s inflation rates:

Year-Over-Year Percentage Increase for PG&E E-6 TOU Off Peak Rate

As you can see, rate increases have been sporadic, as was the case with PG&E’s tiered rate plans, with yearly increases ranging between -0.2% and 28.2%. The average yearly increase, which is what we would use for an energy cost forecast, was 7.1%. This means that if your electricity bill is currently $300, we would expect you to pay about $596 per month in 10 years, and nearly $1,200 per month in 20 years. But in generating a cost savings estimate for you, we’ll likely play it a little more conservative with the annual inflation rate, as we would rather underestimate your potential savings, rather than risk overpromising and end up underdelivering.

Historical SMUD Electricity Rate Increases

SMUD has only offered a time-of-use plan for a couple of years, but by looking at their fixed-rate plan, we can get a rough idea of what to expect from their other plans. The fixed-rate plan has summer and winter rates, and since 2012, their winter rates have stayed relatively stable, while summertime rates have more than doubled from 7.6 cents in 2012 to 16.5 cents in 2019.

Overall, the average inflation rate of the plan has been 6.6%, a bit lower than PG&E’s. If your monthly bill averaged $300 this year, we would expect you to pay $568 in 10 years, and $1,077 in 20 years.

While it’s inevitable that electricity rates will continue to rise, it’s much harder to say exactly how much your electricity bill will increase over time. Everyone’s energy habits are different. Peak rates for PG&E’s time-of-use plans aren’t rising as quickly as their off-peak rates, so if you use more electricity during high-demand periods, your bills may not increase as quickly as another customer’s.

That’s why, if you’re considering going solar, that it’s important to sit down with someone who will analyze your energy usage in detail, give you a savings projection tailored to your unique habits, and answer your questions you have. And that’s our specialty. Give us a call or send us a message, and we’ll be happy to schedule an appointment where we can answer all of your questions and explain how you can get the most out of a home solar power system.