Category: News

Roseville Solar 2.0 is Reducing Solar Electricity Buyback Rates

Roseville Solar 2.0

Over the past few years, with more than $10 million in rebates, Roseville Electric Utility has subsidized the installation of hundreds of residential rooftop solar power systems. Currently, more than 6% of Roseville residents own solar energy systems, and are enjoying significantly reduced or even zeroed-out energy bills.

But, impending changes to how homeowners are compensated for sending unused electricity to the local power grid means that Roseville residents who want to take advantage of the savings offered by solar power need to act now.

Under the net energy metering (NEM) program that California adopted in 2006, utilities were required to offer incentives that allowed residential solar power system owners to reduce or even zero-out their energy bills by selling back electricity to the local electricity grid. But these incentives were only mandated until municipal utilities achieved solar adoption rates of 5%.

Today, more than 6% of Roseville Electric Utility’s customers have installed rooftop solar power systems. In response to achieving the 5% threshold, REU is beginning the process of scaling back their incentives with the rollout of Roseville Solar 2.0, which is scheduled to go live in October of 2018.

Under Roseville Solar 2.0, the per-kilowatt rebate for energy sold back to the grid is going to be reduced by more than 3 cents per kWh.

According to the city of Roseville’s municipal code, the net surplus energy compensated rate is currently $0.0931 per kWh, which is identical to Roseville’s current Tier 1 energy charge. This means that a homeowner that sends back as much electricity as they consume from the grid can zero-out charges for their energy consumption.

However, under Roseville Solar 2.0, the compensation rate will drop to $0.0598 per kWh. Homeowners seeking to zero-out billing for energy consumption will have to send back 55% more electricity than they consume, putting them at a significant disadvantage versus the terms of NEM 1.0.

But for Roseville homeowners who install a system before Roseville Electric Utility’s anticipated launch in October 2018, they will be grandfathered into the current compensation for up to 20 years. By acting quickly, you can be paid more than 50% more for the electricity that you generate than you would be under NEM 2.0.

There are also other important reasons why you shouldn’t wait to go solar. For instance, most California energy consumers will be transitioned to time-of-use pricing over the next couple of years. Under this pricing structure, the energy rate varies depending on the day of the week and time of day. During high-demand periods, prices may increase by several cents per kilowatt-hour. And homeowners will be dismayed to learn that even the lowest time-of-use prices can be 30 to 40 percent higher than their previous flat-rate pricing.

Between Roseville Electric Utility’s changes to their buy-back rates, and the rollout of time-of-use pricing, you can see why we’re urging homeowners in the region not to hesitate when it comes to buying a home solar power system. To learn more about how Roseville Electric Utility’s impending program rollout is going to affect you, visit Capital City Solar on June 21st for our monthly 3rd Thursday event. We’ll answer all your questions about net energy metering, Roseville Solar 2.0, and how you can ensure you are grandfathered into the old energy compensation rate.

How Fast is Solar Power Technology Getting Cheaper? Should You Wait to Buy?

Are there new cutting edge solar technology advancements on the horizon?

Our installers and product specialists are often asked by customers, “Why should I buy solar now, and not wait for better technology? Won’t next year’s solar panels be better than what you have now?”

This question is based upon the assumption that, much as this year’s iPhone is faster and has more features than last year’s model, the capabilities of the solar panels of tomorrow will be leaps and bounds beyond what today’s can manage.

We would love to see the efficiency and output of solar panels improve rapidly, so that we can better meet the world’s growing energy demands in an environmentally friendly fashion. However, there is no magical innovation on the horizon that will render today’s solar panels woefully outdated.

The silicon cells used in solar panels have inherent limits of efficiency, and we’ve just about reached those limits.

A determining factor in the effectiveness of a solar panel is its energy efficiency—the percentage of the sun’s energy that it can convert into usable electricity. Way back in 1960, Hoffman Electronics Semiconductor Division revolutionized the world of solar panel research by creating a solar cell with an energy efficiency of 14%. Today, nearly 60 years later, SunPower’s X22 panel is the most efficient solar panel on the market, with an efficiency of… 22.7%.

How is it that we’ve made so little progress since 1960? In that timespan, computers have become billions of times more powerful, incandescent lights have been replaced by LEDs that produce the same amount of light with only a fraction of the electricity, and cars have become vastly more fuel efficiency. Why have we made so little progress?

Innovations in solar energy haven’t made solar panels vastly more efficient, but rather, vastly more affordable.

The 14% efficiency panels developed by Hoffman Electric back in 1960 were incredibly costly. In fact, this was the case for all solar panels. This is why the technology only saw use in satellites and spacecraft through the 1970s, and then in products with minute energy demands, such as calculators.

Continued developments in solar cell technology didn’t result in solar panels that were vastly more efficient, but which were instead vastly cheaper to make, and within the financial reach of homeowners and small businesses.

Why has solar power become cheaper, but not better?

The problem lies in the inherent qualities of the crystalline silicon used to create solar cells. Scientists believe that the maximum energy efficiency of a crystalline silicon-based solar cell is about 29%. And even that efficiency is unattainable in practice, due to the unavoidable inefficiencies of a fully constructed solar power module.

In short, we’re hitting a ceiling. According to some estimates, in 10 years we’ll have commercially practical panels with efficiencies of about 26%—only about 3 percentage points higher than what a homeowner can buy today.

Some researchers are trying to work around the limitations of crystalline silicon with clever innovations. For instance, one research team created a panel with an efficiency of 44.5%, thanks to a design featured stacked cells and a complex series of lenses. However, the expense and delicate nature of these complex panels will put them out of the reach of consumers for decades—if they ever become affordable.

This is why next year’s solar panels won’t be vastly better than what’s on the market today—we’ve maxed out the limitations of the technology. And unfortunately, there’s nothing new on the horizon. There’s no evidence of some new wonder material that will transform the industry.

The price of solar panels should continue to come down, barring unforeseen developments like the newly imposed tariffs on foreign-made solar panels.

But solar panel prices will not decrease quickly enough to outweigh the benefits of buying a solar power system now.

According to the California Energy Commission, the average household in Sacramento County used 4,795 kWh of electricity in 2016 (the most recent year for which they have data). Even at PG&E’s lowest residential wintertime time-of-use rate, this represents an annual energy cost of $1,283.

Capital City Solar customers typically see their energy bills drop by at least 75% after purchasing a solar power system. Applying that to our unrealistically low annual energy cost of $1,283, that represents a savings of $962.

That solar power system you’re considering right now won’t cost a thousand dollars less this time next year. It will cost you more to wait than it will to buy a system today, and start enjoying a significantly lower energy bill.

To learn more about how solar power can help you save money on your energy bill, contact Capital City Solar today!

Solar Power System Financing Options

Residential and commercial solar power systems offer significant financial benefits, especially in the face of rising time-of-use electricity rates. Many system owners see savings of 75% or more on their electricity bills.

In order to see those savings, you must first invest in a solar energy system for your home. Thankfully, there are many low-cost financing options available to help cover the cost of buying and installing a system.

SunPower Solar Loan

SunPower is one of the largest and oldest solar panel manufacturers in the country. In addition, they make some of the best solar panels anywhere, which is why we’re proud to be a SunPower Elite Dealer and Commercial Dealer.

To help cover the cost of their systems, SunPower offers a SunPower Solar Loan, with generous lending and payback options. This financing option is most popular with our customers. One of the big attractions is that the loan is tied to the solar system hardware. You don’t need equity in your home in order to receive the loan. This provides a great deal of peace of mind, especially for those who have just purchased a home.

What do you need to know?

  • SunPower offers the industry’s highest loan limit.
  • The first payment won’t be due until after the system is installed
  • Pay off the loan in full at any time, with no penalties.
  • If you sell your home, the loan is transferrable to the buyer.

For those buying a SunPower solar power system, SunPower’s in-house financing option is a great choice.

The terms and rates of the SunPower Solar Loan range from 10-20 years and have interest rates ranging from 3.99% to 5.49%*

*If a homeowner elects to pay by check, rates will increase by .25%

PACE Financing – Property-Assessed Clean Energy

Property Assessed Clean Energy (PACE) is a financing program funded via private capital that aims to make solar power systems more affordable for homeowners, businesses, and industrial operations.

The program is structured so that repayment is rolled into property tax payments, typically over a period of 20 years. There is no credit check necessary, as PACE is tied directly to your home or commercial building. Because of this, the repayment obligation transfers with the property. However, if you are planning on selling your property before you finish paying for your system, the buyer may require that you settle all liens beforehand.

There are a variety of PACE programs, including CaliforniaFIRST, HERO, mPOWER, Ygrene, and more. Capital City Solar can help you identify the best option for your home or business.

Solar Power System Leasing

Just as it’s possible to lease a car rather than buy, there are many solar power system leasing programs available. As with financing, leases typically have a 20-year term, and the payment obligation can be easily transferred if you sell your home or business, or you can choose to pay it off early with no penalty.

If your system underperforms, you’ll be compensated accordingly, but you won’t be subject to any increased costs if your system overperforms.

One of the biggest benefits of leasing is that you start enjoying energy savings immediately, with no money out of pocket up front. This is an especially good option for those that have no use for a tax credit.

When the 20-year term ends, the system will be removed at no cost, or you can purchase the system at fair market value. Due to the length of the agreement, leasing isn’t best for families that may want to add additional panels in the future.

Power Purchase Agreements (PPA)

Power Purchase Agreements, commonly referred to as PPAs, are a means of allowing you to enjoy many of the benefits of having a solar power system, without actually buying one.

In a PPA, a third party covers the cost of a solar power system and its installation on your property, and covers the cost of operating and maintaining it. In turn, you pay for the energy produced by the system, but at a price lower than what your utility company charges for power off the grid.

Whereas a lease agreement has a fixed monthly cost, your PPA payment will vary month to month, as production varies with seasonal changes. Thus, you’ll pay more in the summer when the system produces more energy, and less in the winter when generation is reduced.

PPAs vary greatly, with terms ranging from 10 to 25 years. Bear in mind, if you choose a PPA, only the owner of the system is eligible for any related financial and tax incentives.

Home Equity Line of Credit (HELOC)

HELOCs have long existed as an alternative (or supplement) to traditional mortgages. The flexibility of HELOCs make them a good choice for covering the cost of a solar power system.

There are many financial incentives for choosing a HELOC. You can write off the interest on your taxes, lowering your federal tax liability. In addition, the 30% federal tax credit goes straight to you, rather than paying down a traditional loan.

The typical return on investment for buying a solar power system using a HELOC is 5 to 7 years.

If you would like to learn more about what financing options are available for a residential or commercial solar power solution, contact Capital City Solar today by calling 916-782-3333, or filling out our contact form. And be sure to refer your friends as well! We offer customers a $250 referral person for each referred friend or family member who purchases a solar power system from Capital City Solar.

Time-of-Use Pricing, and Why It’s Going to Raise Your Electricity Bill

Time-of-Use Rates & Increasing Electricity Bills

Going back decades, energy bills have been incredibly simple to calculate. Take the amount of electricity you use, multiply that by the current price per kilowatt-hour (kWH), tack on some miscellaneous fees and taxes, and that’s it.

But in recent years, energy companies like PG&E have been pushing to change how we pay for electricity. The reality is that it costs more to produce electricity when it’s most in demand, versus during periods of low demand. When the majority of Americans get home from work between 5 and 6 pm and turn on the lights and HVAC system, and cue up Netflix while putting dinner in the oven, energy demand increases. This increased demand causes an even more significant increase in energy costs.

And this is a trend that’s becoming increasingly evident in California. Last year, the U.S. Energy Information Administration published an article highlighting how electricity prices in California have been increasing year-over-year during daily high demand periods.

California Energy Price Breakdown by Hour

In 2016, the price of electricity at 8 PM was $35 per megawatt-hour. Just a year later, it was nearly $60. This is in part because California energy companies like PG&E are relying increasingly heavily on renewable sources of energy, such as solar power farms. During low demand periods when there isn’t much need for auxiliary sources of energy, this significantly decreases the cost of producing electricity, as evidenced by the decrease in low demand period prices in the graph above.

But the problem is that due to the way the energy market has changed, it’s much more costly for energy utilities to fire up additional power plants when they are needed, causing prices to skyrocket in the morning and evening. But for homeowners and businesses paying a standard fixed price for their electricity, there is no means for electricity providers to recoup the costs for providing electrical service during these periods of peak demand, aside from increasing the overall price of electricity.

Which is why PG&E, SMUD, and other major California energy utilities are in the process of shifting over to a new pricing system, called “time-of-use.”

Time-of-use pricing is exactly what it sounds like—the cost of your electrical usage depends on when you use electricity in your home or business.

Time-of-use (TOU) pricing breaks up the day into multiple blocks, with the cost of electricity varying from block to block, depending on typical demand during that timeframe. For instance, as of April 2018, PG&E’s time-of-use rate plan is scheduled accordingly (there are multiple TOU plans, but we’ll use E-TOU-A for the sake of simplicity):

  • Mon-Fri, 12 AM to 3 PM and 8 PM to 12 AM: Off-Peak Pricing
  • Mon-Fri, 3 PM to 8 PM: Peak Pricing
  • Sat-Sun, All Day: Off-Peak Pricing

While this is seemingly simple, there is an additional wrinkle. Between June and September, the off-peak rate is $0.32 and the on-peak rate is $0.40. From October to May, the off-peak rate is $0.27 and the on-peak rate is $0.28. Thus, the price PG&E customers pay varies not only depending on the time of day, but also the time of year.

Many energy consumers are unprepared for the sky-high bills they will face with time-of-use pricing.

The truly striking thing about TOU pricing is how expensive it is across the board, versus flat-rate pricing. For comparison, PG&E customers on the traditional flat-rate plan, the baseline price per kWh is currently $0.21, a full 6 cents less than the lowest off-peak TOU rate, and 11 cents less than the summertime on-peak rate.

As time-of-use becomes the standard (as will be the case with PG&E by 2020), consumers will not only be transitioned to a more dynamic pricing system, but an overall more expensive one.

For example, let’s consider a homeowner who lives just outside of Sacramento, and whose house is powered by PG&E. In the month of May, historically they have used about 1,000 kWh, on average. Assuming they don’t get hit with any surcharges for excessive use on any particular day, their energy bill for May 2018 would be $212, excluding fixed costs and other fees.

But this year, PG&E switches them from their old rate plan to time-of-use. Like most people, the homeowner works during the day and is home in the evenings, and their behavior varies during the weekends. Consequently, in May they use 70% of their energy, or 700 kWh, during on-peak hours (weekdays 3-8 PM), and the remaining 30% (300 kWh) during off-peak hours.

With PG&E’s current TOU pricing, their energy bill this May would be $377, a 78% increase over what they would have paid under PG&E’s old pricing system. This should give you a hint as to financial pinch that California residents are going to feel when the switchover to time-of-use pricing is complete.

And that hit to the pocketbook is only going to get worse. Another important but overlooked consideration for homeowners is how the gap between on-peak and off-peak pricing has been growing over the last decade. While the residential TOU rate plans PG&E is putting into effect have only existed for a couple of years, examination of PG&E’s commercial TOU rates reveals a widening gap between on-peak and off-peak costs. In mid-2013, the difference between summer on- and off-peak pricing for commercial A-1 was 3 cents. Mid-2014, it was 3.5 cents. Now, the gap is more than 5 cents.

The trend is quite clear. As time goes on, it’s highly likely that the gap between off- and on-peak pricing will continue to grow. Power will be exorbitantly expensive when you need it most: when you get home from work and flip on the air conditioning, your children turn on the television, you switch on the oven to cook dinner, and you turn on the lights as the sun goes down.

Residents of California, and indeed the United States as a whole, are going to have to drastically change their lifestyles to accommodate this unpleasant reality. How you live and work in your home will have to change to reduce your energy footprint, or you will have to simply eat the higher bill, provided you can afford it.

But there’s another option: residential solar electricity systems.

An increasing number of California residents have been installing rooftop solar energy systems as a way to significantly reduce their dependence on their local energy utilities. With the way that energy prices are soaring, the time to break even on the up-front cost of buying a system has been dropping rapidly.

Currently, we estimate that the typical homeowner will save enough money on their energy bills to offset the total cost of a solar energy system in about 5 to 7 years, depending on usage and local energy rates. As utility prices continue to rise, this figure will drop. This is why we strongly recommend that homeowners consider the installation of a solar energy system as soon as possible. We might estimate that, according to your current usage and energy prices, that you’ll break even in 7 years. But next year, energy prices might skyrocket, and you’ll be spared the financial pain your neighbors suffer every time their PG&E or SMUD bill shows up in the mail.

In addition, we anticipate home battery storage solutions to become a significant means of improving the flexibility and efficiency of newly and previously installed systems, further improving the savings realized by homeowners.

To learn more about time-of-use pricing, and how a solar power system can help your pocketbook, contact Capital City Solar today by calling 916-782-3333, or by sending us a message using our contact form.

What’s the Value of Solar Energy Monitoring?

Home Solar Power System Monitoring

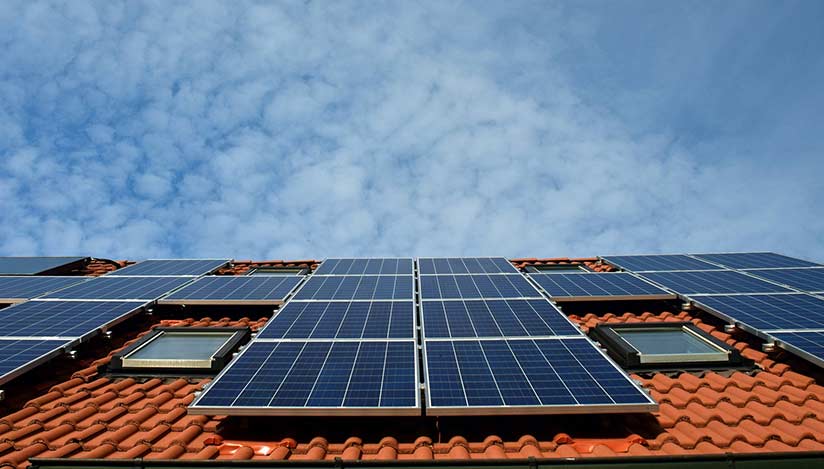
The sun is shining, there isn’t a cloud in the sky, and your roof is in full sunlight. But how can you tell if the photons raining down on your rooftop solar power system are actually being turned into useful electricity?

There are no moving parts, so unlike your car or a backyard pool pump, there’s no way to tell just by looking or listening whether you’re getting the performance you paid for. Thankfully, there are a few things to look out for on a solar energy system, such as whether:

  • There’s a green light on the inverter
  • Your energy meter is running backwards
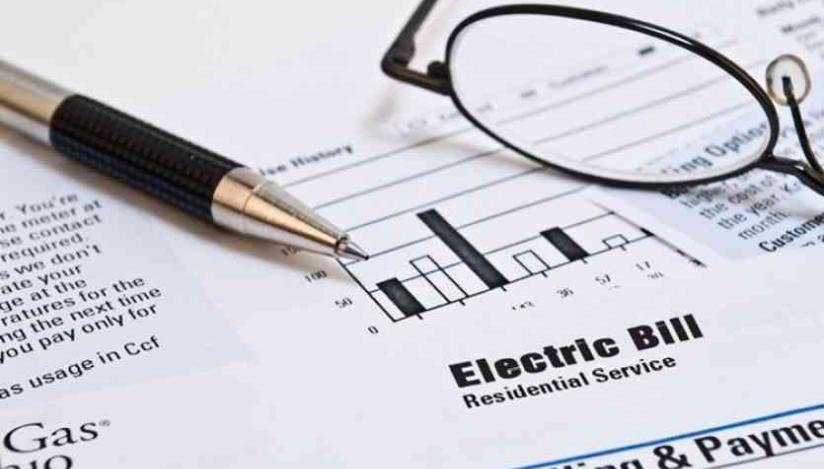
  • Your electric bill is under control

But there’s a great way to take this a step further, and know minute to minute whether your system is delivering as promised: Your solar monitoring system.

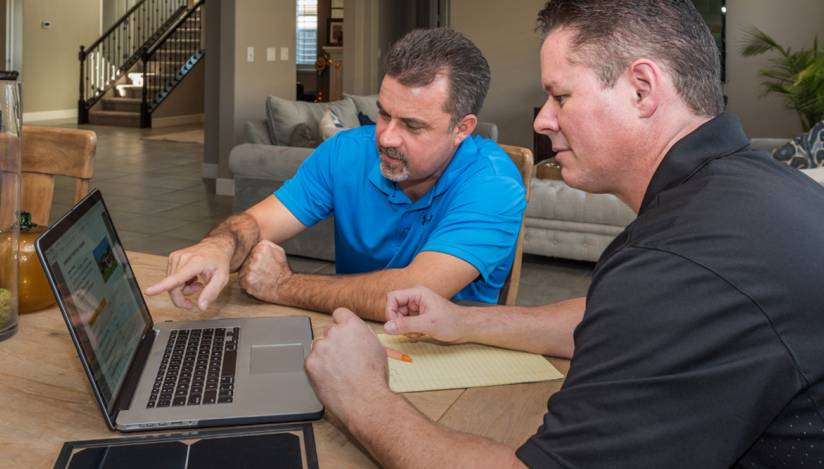
At Capital City Solar’s monthly Third Thursday event on March 15th, we discussed the value of a solar energy monitoring system, and how to get the most out of it. Below, you can see an overview of what we talked about during that event, and find out what we’ll discuss at our April Third Thursday event.

Home Solar Power System Monitoring

How does a solar energy monitoring system work?

On solar energy systems manufactured by SunPower, the system comes equipped with a PVS5, a processor and transceiver which acts as the ‘brain’ of your system recording, collating, and reporting your system’s performance. Many systems have their own version of this information gateway.

This device records your system’s production, gathering data every 15 minutes and exporting it to online software, which then makes it accessible online through a monitoring portal.

SunPower Monitoring Dashboard

Above is an example of the dashboard that appears when first logging into a SunPower monitoring system. On the left, you can see the last reading of the amount of power being generated by the system, as measured in kilowatts (kW).

Next, the Today’s Energy table tells you how much energy your system has produced so far, as measured in kilowatt-hours (kWh). The graph below breaks this production down, hour by hour.

The last table tells you how much you’ve reduced your carbon dioxide emissions by over the lifetime of the system. Clicking on the ‘more’ dropdown arrow gives you additional examples of what this reduced footprint looks like.

Carbon Dioxide Emission Savings

How often should you check your system’s output?

Think of your solar panels like you do your car. Every month or so, you probably check your fuel consumption—in terms of miles per gallon—as well as other elements essential to continued optimal operation, such as the condition of your tires, oil, belts, etc.

With a solar power system, you’ll want to check the number of kWh produced per month.

Monthly Solar Power Output

The 2017 monthly output for a SunPower system.

You can actually set up your system to generate a monthly report that is emailed directly to your email inbox, so you don’t have to worry about remembering to log in and check your system.

Output can be affected by a number of different factors, especially the weather, but if the output is close to that estimated in the anticipated output breakdown provided to you by your system installer, as adjusted for expected degradation, then you’re probably in good shape.

If something seems significantly out of the ordinary, and you can’t account for it—such as a downtrend in production during a summer that was consistently sunny and clear, or a significant loss in production year over year—then it’s probably time to give your installer a call.

What can cause a loss of energy production?

Weather and seasonal changes. Your solar panels can only convert sunlight they receive. For starters, production is lower in winter and higher in summer not just because of the weather, but also because the angle at which sunlight hits your roof. During winter in the northern hemisphere, sunlight comes in at a steeper angle, and we receive less sunlight. In summer, the sun is more directly overhead, and we receive more sunlight. In addition, variations in the weather do make a difference. If your panel output is 5% lower in a June that is unseasonably cloudy, versus a nice clear June last year, then your system is probably fine.

A bad panel. If even a single panel has subpar performance, it can reduce production by up to 10%. If your system uses a central inverter, performance can be more severely impacted, as such a system only performs as well as its weakest link.

Shading. Trees grow over time. That small tree that didn’t shade your home five years ago might cast a significant shadow across your roof these days. Make sure to keep up on tree trimming to ensure optimal power production.

Dirt and soil. Are your system’s solar panels as shiny as the day they were installed? Or do they have a dull, matte, lusterless look? You could be losing energy production simply because dirt and other contaminants have accumulated on your array. If you’re in an area susceptible to brush fires, ash can be particularly sticky, and ash accumulation can significantly reduce output.

Loose wiring. Much of Central California is susceptible to occasional high winds, and a wire that’s knocked loose can cause resistance, reducing your system’s output. Something as simple as reconnecting a loose wire can restore your system performance.

Solar energy system monitoring allows you to realize the full potential of your investment.

You’ve made a significant investment in your home. If you take the time to occasionally check the condition of your roof, car, or backyard swimming pool, then it only makes sense to keep a close eye on the performance of your solar energy system as well. Use the technology available to you to ensure that your investment is providing the savings you paid for!

If you found this article to be useful, we invite you to check out Capital City Solar’s future Third Thursday events. Our next Third Thursday will take place on April 19th at 5 PM and will focus on the topic of financing options available specifically for covering the cost of installing a new home solar energy system:

Homeowners frustrated with rising electricity prices often feel that home solar electricity systems are priced beyond their reach. However, there are a number of exciting financing options available to help you take advantage of the cost saving benefits of solar! For instance, the state and municipally funded PACE Program offers no-down payment plans ranging from 5 to 25 years, which build repayment into your annual property taxes.

But this is just the tip of the iceberg. Visit Capital City Solar on April 19th for our Third Thursday discussion of solar financing, where you can learn how you can make a home solar electricity system fit your budget!

The event will be located at our office at 111 Derek Place, Roseville, California 95678, and feature free refreshments and snacks. Like our Facebook page and be the first to learn more, or simply mark your calendar for 5 PM on April 19th! If you’re unable to make it, be on the lookout for a future blog post, in which we’ll summarize the information covered during the event. But we hope you join us, and look forward to seeing you there!

Solar Panel Production, Efficiency & How to Compare Systems

How to Compare Solar Panel Production and Efficiency

When shopping for a new car, it’s second nature to compare features like fuel economy, horsepower, price, and so on. But when it comes to buying a home solar power system, consumers often feel confused about how to compare options.

Many solar power system installers recognize this confusion, and take advantage of it by marketing big benefits that don’t really add up when you look more closely.

When shopping for solar power systems, there are two key variables to consider when comparing options: production and efficiency.

Production is simply the amount of electricity produced by a module or system.

Both individual solar modules (or “panels”) and entire systems have an estimated power rating (Pnom)—the amount of electricity that can be produced. Although this figure can’t be replicated in the real world, Pnom represents the absolute maximum potential power production for a given module or system. And those ratings are a handy means of making comparisons and identifying potential shortcomings.

For instance, let’s say you’re entertaining two bids for solar power systems, both of which have a total Pnom of about 4.8 kilowatts, or 4,800 watts.

Bid #1: This system uses 13 of the new SunPower X22-370-D-AC modules, which have a Pnom of 370 watts.

Bid #2: This system is cheaper, which makes it attractive, as it also produces about 4,800 watts. Same amount of power, but less expensive. However, when digging into the specs, you see that it uses Canadian Solar CS6K-300MS panels with a nominal power of 300 watts. The fact that it uses modules with a lower output is an immediate tipoff that it has to use more modules to produce the same amount of power. A look at the bid shows that yes, the Canadian Solar system uses 16 panels, versus 13 for the SunPower system.

The issue: While the two systems in this example produce the same amount of power, the lower nominal power of the Canadian Solar modules means that more modules must be used to compensate. This in turn means that the cheaper system will take up more of the roof—using 23% more panels means it will take up 23% more space. The SunPower system only needs about 80% of the roof space to produce the same amount of power as the Canadian Solar system—a factor very important for homeowners who wish to preserve the appearance of their home.

The Takeaway:

  • Production = Maximum amount of electricity produced by a solar module or system
  • Lower production = More roof space needed to produce the same amount of electricity
  • Higher production = Less roof space needed

Efficiency measures how much solar energy is converted to electrical energy.

Solar panel efficiency is simply a measurement of how much solar energy, when absorbed by a module, is converted to usable electricity. If, on a sunny day, 1,000 watt-hours of solar energy is collected by a 20% panel every hour, the panel will produce 200 watt-hours per hour. On a cloudy day where the panel only receives 500 watt-hours of sunlight per hour, it will produce 100 watt-hours per hour.

A few years ago, high-end panels had an efficiency of about 12% to 15%. Nowadays, many panels are in the 18% to 19% range, with some, like SunPower’s X-series panels, breaking 22%.

The efficiency of the panels used has a direct impact on how much space your system will need.

Example: You’re comparing two systems. One uses panels with an efficiency of 20%, and the other an efficiency of 15%. Straightaway, this tells you that the 15% system is going to have to be a lot larger to equal the production of the 20% system.

In fact, it’s pretty easy to figure out just how much larger—just take the larger efficiency and divide it by the smaller. In the case, 20 divided by 15 is 1.33, which means that a system using 15% efficiency panels will need to be 1.33 times (or 33%) larger than a 20% efficiency system to produce as much electricity. (That’s because a 15% panel produces 25% less electricity than a 20% panel.)

The Takeaway:

  • Efficiency = The percentage of solar energy converted to electrical energy by a solar panel
  • Higher efficiency = Less surface area needed to produce the same amount of electricity
  • Lower efficiency = More surface area needed

While it’s tempting to only consider the total power production of a system, the production and efficiency of the system has a significant impact on your quality of life.

For most homeowners, a home solar electricity system is an investment. This investment may be motivated by financial concerns about climbing electricity bills, or out of a desire to improve the state of the planet by reducing reliance on fossil fuels. But quality of life is also an important consideration for many homeowners.

Most homeowners are much happier with their systems when their aesthetic impact is minimized. Not only do larger solar power systems block more of the roof from view, but they also require more holes to be punched through the roof during the installation process. For those who love the look of their home, it’s critical to seek out systems that use higher efficiency, higher production modules.

In addition, using less roof space provides greater opportunity for expanding your system in the future. For instance, if you purchase an electric vehicle in the future, you will have the room to expand your system and charge the car. Going the cheaper route by installing a system that uses more modules limits the potential for future expansion.

To learn more about what to consider when choosing the residential solar power system that is right for your home, contact Capital City Solar today by calling (916) 782-3333, or emailing us at info@capitalcitysolar.com.